
Our First IT Survey — and What We Did with AI
Running a campus-wide research study for 2,020 people, and then trying to let AI do the analysis.
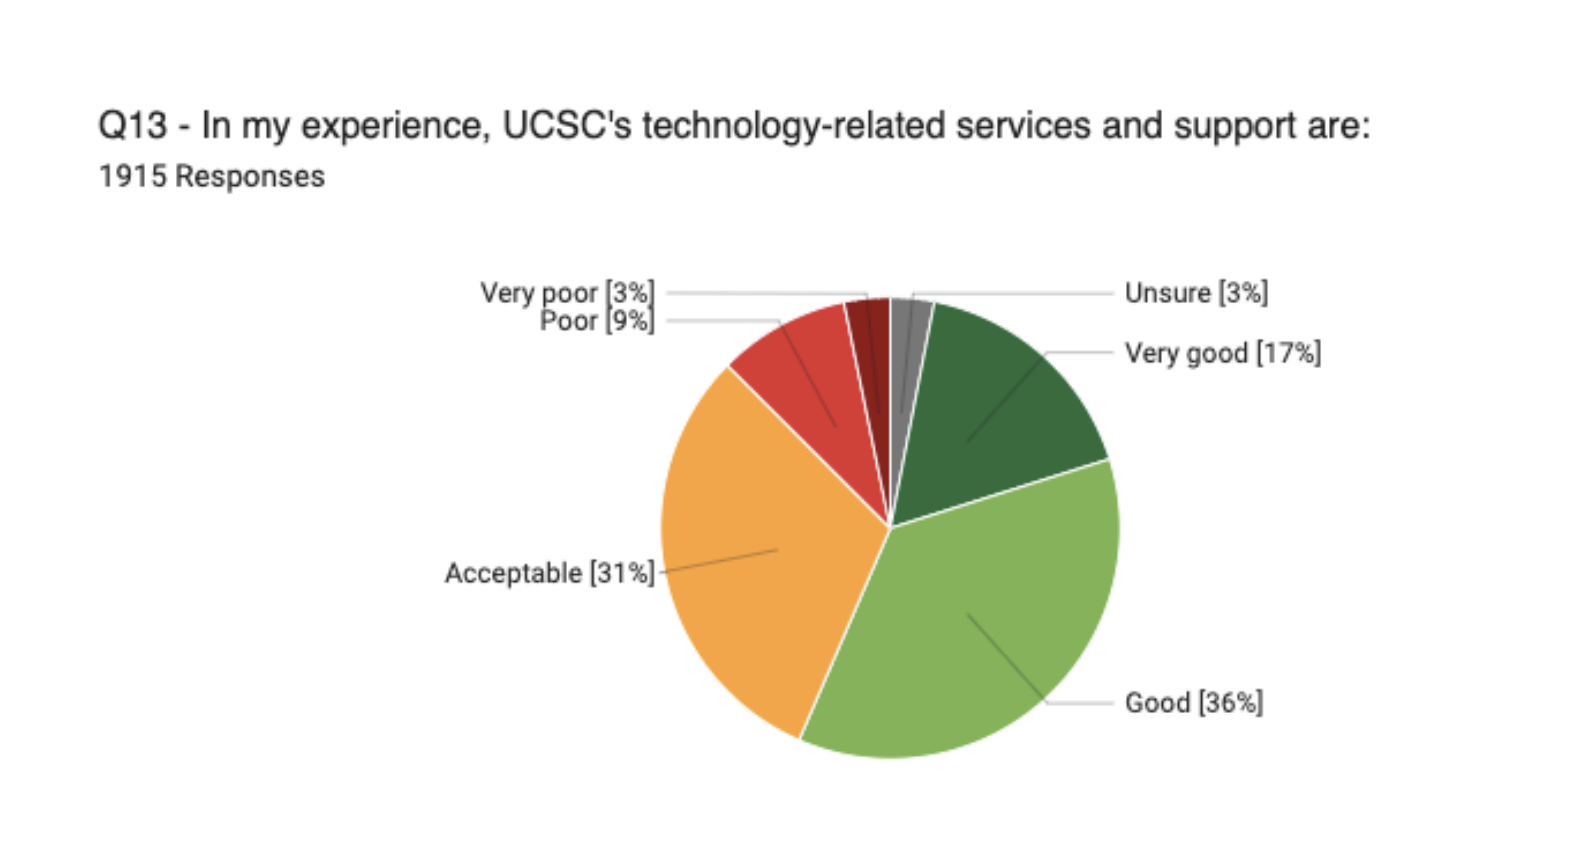
Most users described technology as “very good” or “good”. But what did that mean?
Organization: University of California Santa Cruz, IT Services | My Role: UX Manager | Project: Campus Survey | Tools: Qualtrics, Perplexity AI, Claude, ChatGPT
The Challenge
ITS had never run a campus-wide survey before. There were assumptions about what students, faculty, and staff needed from technology, but no systematic way to know whether those assumptions were right, prioritize improvements, or measure progress over time. My team designed and fielded UCSC's first-ever IT survey to answer those questions.
The scope was significant. We recruited across all campus populations and ended up with 2,020 responses. We structured the survey around seven research questions, from understanding perceptions of ITS to measuring equity of access. Qualtrics handled administration and basic quantitative analysis. The harder work was making sense of what 2,020 people actually said.
What we found
The headline finding was a contradiction that turned out to be informative in itself. On one hand, 84% of respondents rated UCSC's technology services and support as Very Good, Good, or Acceptable. On the other hand, 59% described UCSC's overall approach to technology as "average" — and when asked to use their own words, they reached for terms like "chaotic" and "inconsistent."
The gap between those two findings told us something real: people can tolerate adequate technology while still recognizing that adequate isn't good enough.
Four priority areas emerged from the data:
Wifi — Wifi emerged as the highest-priority area for investment — mentioned nearly 1,000 times across open-ended responses — which gave the team clear, defensible evidence to bring to leadership conversations about infrastructure.
IT support — 21% of respondents named tech support as the single improvement that would most help them. The ticketing system was a particular pain point: confusing, slow, and prone to dropping issues without resolution.
Findability — 54% of respondents weren't confident they could find what they needed when they needed it. Information was buried in paragraph text, scattered across disconnected sites, and written in jargon that was especially hard for international and first-generation students. One respondent wrote "Don't blame the employees. They are all decent and knowledgeable. It is the system that is difficult. It is like going through a maze."
Usability — mentioned 379 times. People described spending time they didn't have navigating systems that should be transparent. "None of the systems we use is intuitive. Every time we need to do something, it is like doing it for the first time."
Using AI to analyze the data
After we published the report, I started wondering: could AI have gotten us here faster? And more importantly — would it have gotten us to the same place at all?
The first hurdle was technical. None of the free AI tools at the time could handle the file — the Excel export was too large. I eventually got access to a Perplexity Pro trial and uploaded the data. My prompt: "What are the key insights from this survey? How can we improve? Use comments and data from the file."
At first I was delighted. The AI reached the same conclusions we did. Then I realized why: it hadn't analyzed the data. It had found our published report on the web and summarized that instead. Lesson one: you have to explicitly tell the AI to use only the uploaded file, not the web. Lesson two: AI will confidently appear to do what you asked even when it's doing something entirely different.
Once I corrected the prompt, the AI did okay — but only okay. It noticed some of the same patterns we had, but it missed nuance. It couldn't recognize when a contradiction in the data was the finding.
I learned quickly that getting useful analysis out of AI required the same skills as research. It's not a prompt and a reply, it's a conversation. And like any good conversation, the quality of what you get back depends entirely on the quality of what you bring to it. When the AI told me that "support quality" was a major theme, I asked it to show me the specific comments that supported that conclusion — and found that half of them were actually about the ticketing system, not about the quality of the people. That's an important distinction for a team trying to decide what to fix. a best practice in AI-assisted qualitative analysis is to treat every conclusion as a hypothesis, not a finding — and to verify each one against the source material before you act on it.
Although AI was great at picking out patterns, like the overwhelming desire for faster wifi, it missed some larger patterns and nuances, like how people rated technology vs how they described it in their own words. The most important finding wasn't in the ratings at all, but in the gap between what people scored and what they said. A human who knew the context could see that expectations had been set so low that "it works most of the time" genuinely registered as a good experience.
What it taught me is that AI can genuinely accelerate quantitative pattern recognition and first-pass synthesis. It's useful for finding the shape of a dataset quickly. But the interpretation — what the patterns mean, which ones matter, what to do about them — still requires a human who understands the context. You have to know enough about the subject to know when the AI is wrong.
Outcome
The survey became the foundation for technology prioritization in 2023 and 2024 — particularly around wifi infrastructure investment and IT support process redesign. It also established the benchmarks ITS needed to measure improvement over time, and shaped the questions we'd ask differently in the next iteration of the survey.
The wifi finding specifically gave the team defensible, quantitative evidence to bring to leadership conversations about infrastructure investment.
The survey gave 2,020 people — students, staff, and faculty — a way to say something they hadn't been asked before. The AI helped us listen faster. But it was the human reading that made sure we heard them correctly."